Example 17: HIV-1 Env MPER-TM Trimer in an Asymmetric, Model Viral Bilayer
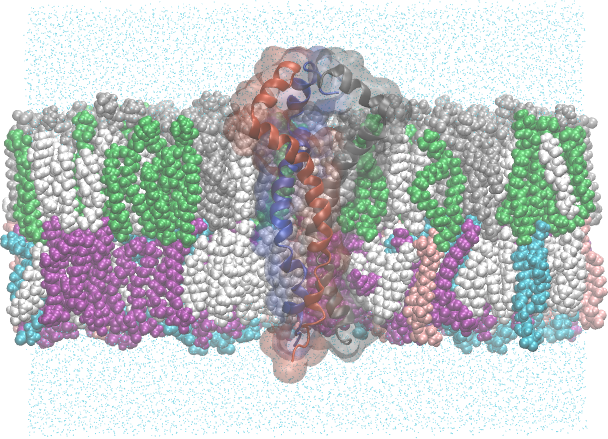
HIV-1 gp41 (MPER-TM) trimer embedded in a model viral envelope lipid bilayer. Bilayer is clipped to show the protein, and each protein chain is colored uniquely. The outer leaflet (top) is composed of 36% Sphingomyelin d18:1/16:0 (CHARMM residue name PSM, colored grey), 17% 3-palmitoyl-2-oleoyl-D-glycero-1-Phosphatidylcholine (POPC, green), and 43% cholesterol (CHL1, white). The inner leaflet (bottom) is composed of 30% 1-Stearoyl-2-Oleoyl-Phosphatidylethanolamine (SOPE, purple), 18% 1-Stearoyl-2-Oleoyl-Phosphatidylserine (SOPS, blue), 9% 3-palmitoyl-2-oleoyl-D-glycero-1-Phosphatidylethanolamine (POPE, pink), and 47% cholesterol.
This example is the same as Example 16: HIV-1 Env MPER-TM Trimer in a DMPC Symmetric Bilayer, but uses a model viral bilayer instead of a DMPC bilayer. The model viral bilayer is constructed from a mixture of lipids that are commonly found in the viral membrane.
# Author: Cameron F. Abrams, <cfa22@drexel.edu>
#
# pestifer input script
#
# Membrane-embedded build of HIV-1 gp41 MPER-TM trimer (6e8w)
#
# NOTE: This example uses NAMD's on-the-fly pressureProfile calculation in the
# post-equilibration NPAT stage and in the packaged production run. CUDA-enabled
# (GPU) NAMD does not support pressureProfile, so this example must be run with
# a CPU NAMD build. Remove the `pressureProfile*` keys from the relevant
# `other_parameters` blocks (or omit `--gpu`) to use a GPU build.
#
title: HIV-1 gp41 MPER-TM trimer 6e8w embedded in model viral bilayer
paths:
  packmol: /usr/local/bin/packmol
tasks:
  - fetch:
      sourceID: 6e8w
  - psfgen:
      source:
        model: 15 # last frame
  - md:
      cpu-override: True
      ensemble: minimize
  - make_membrane_system:
      bilayer:
        SAPL: 60.0
        salt_con: 0.154
        half_mid_zgap: 0.0
        cation: POT
        anion: CLA
        composition:
          lower_leaflet:
            - name: POPE
              frac: 0.09
            - name: SOPS
              frac: 0.18
            - name: SOPE
              frac: 0.30
            - name: CHL1
              frac: 0.43
          upper_leaflet:
            - name: PSM
              frac: 0.36
            - name: POPC
              frac: 0.17
            - name: CHL1
              frac: 0.47
        seed: 270272
        nloop: 100
        nloop_all: 100
        relaxation_protocols:
          patch:
            - md:
                ensemble: minimize
                nsteps: 1000
            - md:
                ensemble: NVT
                nsteps: 1000
                temperature: 310
            - md:
                ensemble: NPT
                nsteps: 1000
                temperature: 410
                pressure: 10.0
            - md:
                ensemble: NPT
                nsteps: 2000
                temperature: 410
                pressure: 10.0
            - md:
                ensemble: NPT
                nsteps: 4000
                temperature: 360
                pressure: 10.0
            - md:
                ensemble: NPT
                nsteps: 8000
                temperature: 310
                pressure: 10.0
            - md:
                ensemble: NPT
                nsteps: 16000
                temperature: 310
                pressure: 4.0
            - md:
                ensemble: NPAT
                nsteps: 16000  # this is probably too short!
                temperature: 310
                pressure: 1.0
          quilt:
            - md:
                ensemble: minimize
            - md:
                ensemble: NVT
                nsteps: 1000
                temperature: 310
                pressure: 1.0
            - md:
                ensemble: NPT
                nsteps: 2000
                temperature: 310
                pressure: 1.0
            - md:
                ensemble: NPT
                nsteps: 4000
                temperature: 310
                pressure: 1.0
            - md:
                ensemble: NPAT
                nsteps: 8000
                temperature: 310
                pressure: 1.0
      embed:
        xydist: 20
        zdist: 10
        z_head_group: "protein and resid 667"
        z_tail_group: "protein and resid 710"
        z_ref_group:
          text: "protein and resid 696"
          z_value: 0.0
  - md:
      ensemble: minimize
      minimize: 1000
      constraints:
        k: 10
        atoms: protein and name CA
  - ring_check:  # there are sterols!
  - validate:
      tests:
        - residue_test:
            name: test of protein presence
            selection: protein
            measure: residue_count
            relation: '>='
            value: 1
  - md:
      ensemble: NVT
      nsteps: 1000
      constraints:
        k: 10
        atoms: protein and name CA
  - md:
      ensemble: NVT
      nsteps: 6400
      temperature: 310
      constraints:
        k: 1
        atoms: protein and name CA
  - md:
      ensemble: NPT
      nsteps: 1000
      temperature: 360
  - md:
      ensemble: NPT
      nsteps: 2000
      temperature: 310
  - md:
      ensemble: NPT
      nsteps: 4000
      temperature: 310
  - md:
      ensemble: NPT
      nsteps: 8000
      temperature: 310
  - md:
      ensemble: NPT
      nsteps: 16000
      temperature: 310
  - md:
      ensemble: NPT
      nsteps: 32000
      temperature: 310
  - md:
      ensemble: NPAT
      nsteps: 51200  # this is way too short!!
      temperature: 310
      other_parameters:
        pressureProfile: on
        pressureProfileFreq: 100
        pressureProfileSlabs: 20
  - mdplot:
      timeseries:
        - [cpu_time, wall_time]
        - density
        - [a_x, b_y, c_z]
      profiles:
        - pressure
      basename: bilayer
  - terminate:
      basename: my_6e8w
      artifacts: artifacts
      package:
        basename: prod_6e8w
        namd:
          ensemble: NPAT
          firsttimestep: 0
          dcdfreq: 10000
          xstfreq: 10000
          outputenergies: 1000
          nsteps: 10000000
          other_parameters:
            pressureProfile: on
            pressureProfileFreq: 10000
            pressureProfileSlabs: 20
Step |
Task |
Details |
|---|---|---|
1 |
|
|
2 |
|
standard build |
3 |
|
minimize |
4 |
|
CHL1, POPC, POPE, PSM, SOPE, SOPS |
5 |
|
minimize |
6 |
|
check for ring-threading defects |
7 |
|
1 test(s) |
8 |
|
NVT (7,400 steps, 2 phases) → NPT (63,000 steps, 6 phases) → NPAT (51,200 steps) |
9 |
|
equilibration time-series plots → |
10 |
|
basename: |
Results
The plots below are generated by default during the membrane-building process.
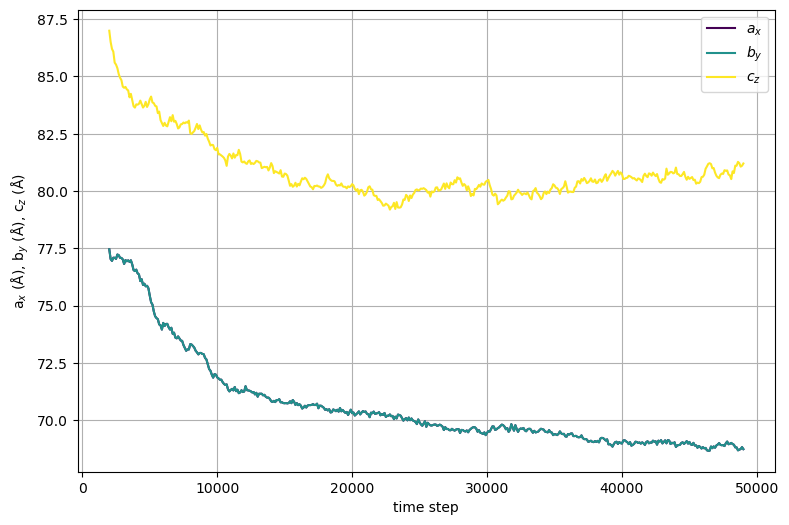
Cell dimensions vs time step for the initial symmetric 200-lipid bilayer patch from which the upper leaflet is extracted.
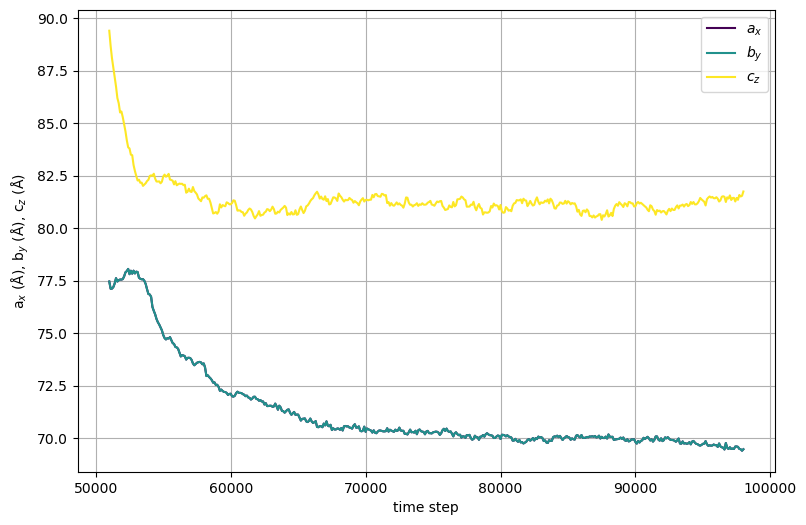
Cell dimensions vs time step for the initial asymmetric 200-lipid bilayer patch from which the lower leaflet is extracted.
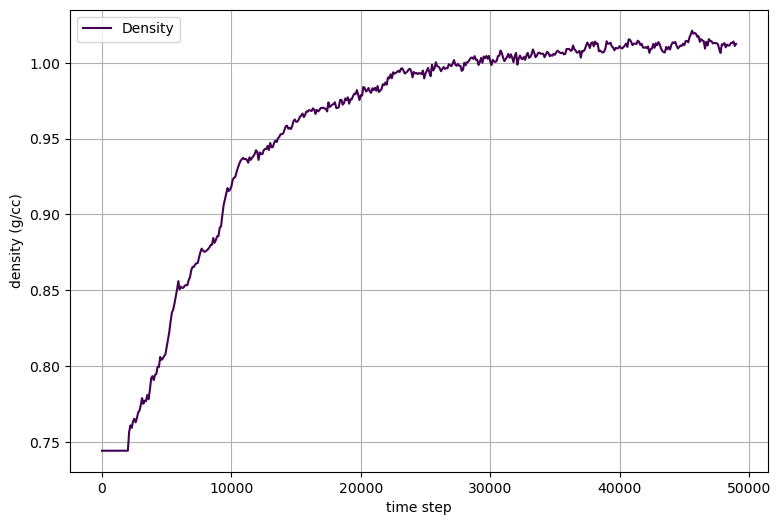
System density vs time step for the initial 200-lipid bilayer patch from which the upper leaflet is extracted.
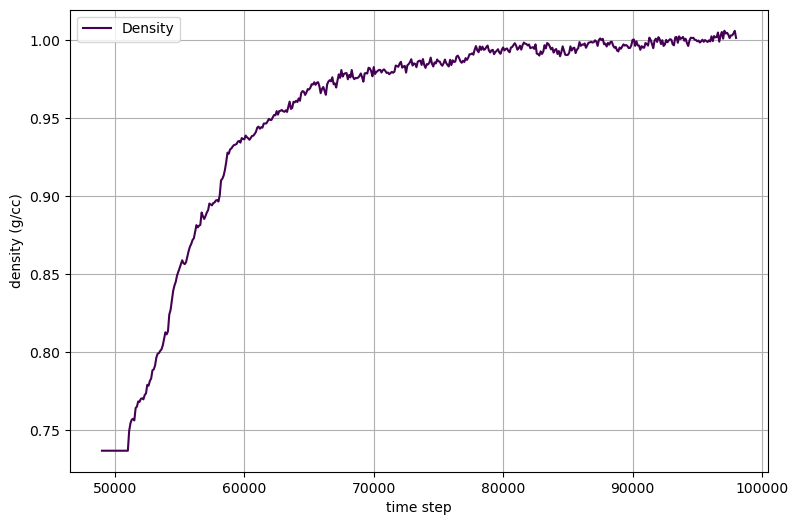
System density vs time step for the initial 200-lipid bilayer patch from which the lower leaflet is extracted.
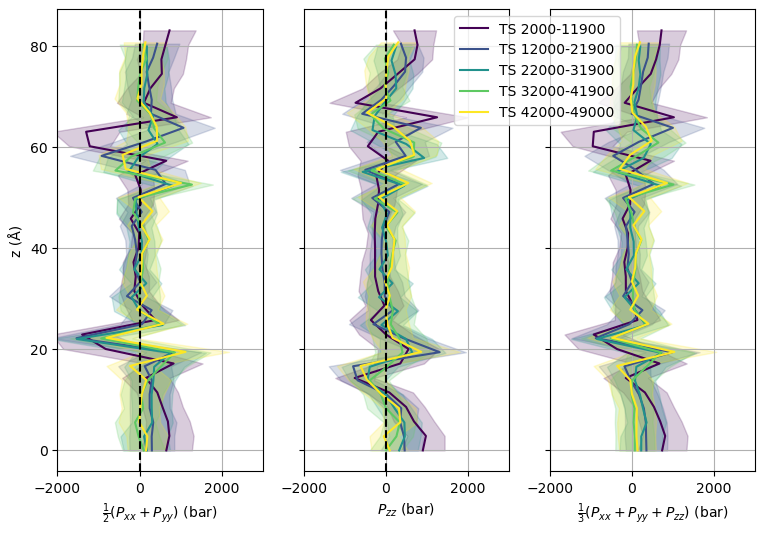
Pressure profiles for selected time intervals during relaxation of the upper leaflet bilayer patch.
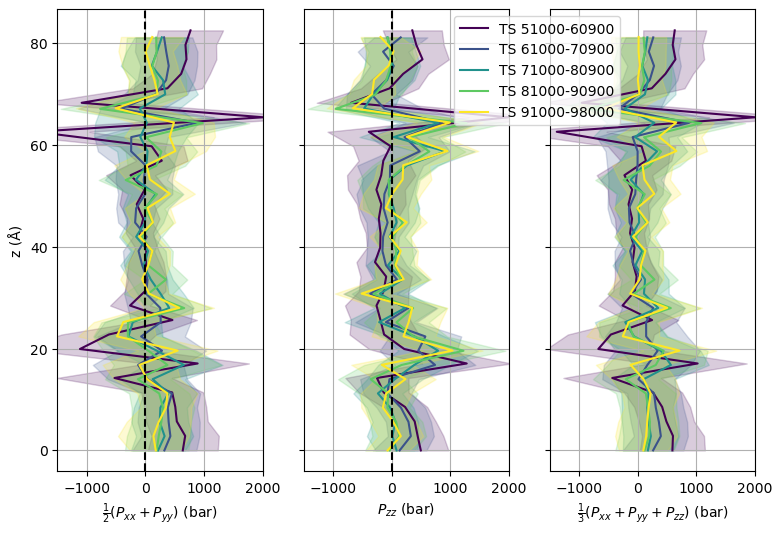
Pressure profiles for selected time intervals during relaxation of the lower leaflet bilayer patch.
The mdplot task generated the following plots for the membrane-embedded system.
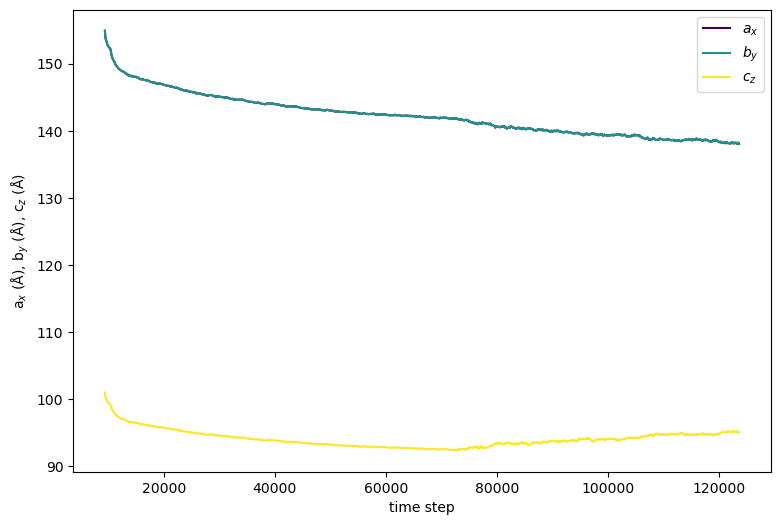
Cell dimensions vs time step for the protein-embedded membrane.
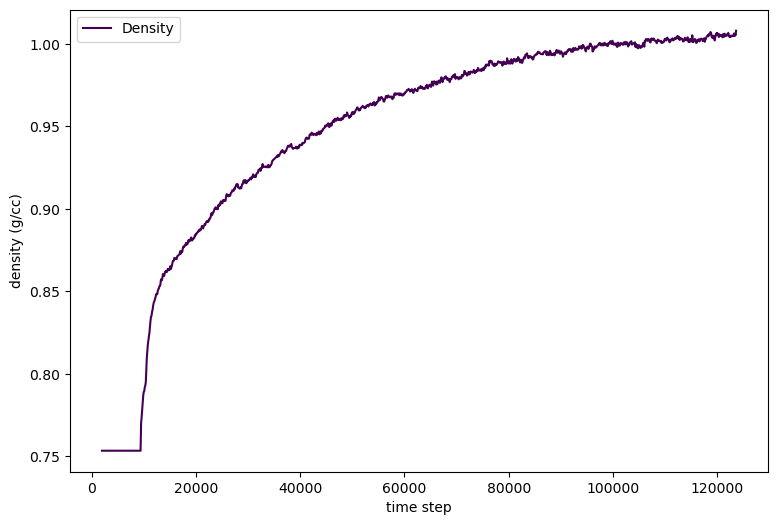
System density vs time step for the protein-embedded membrane.
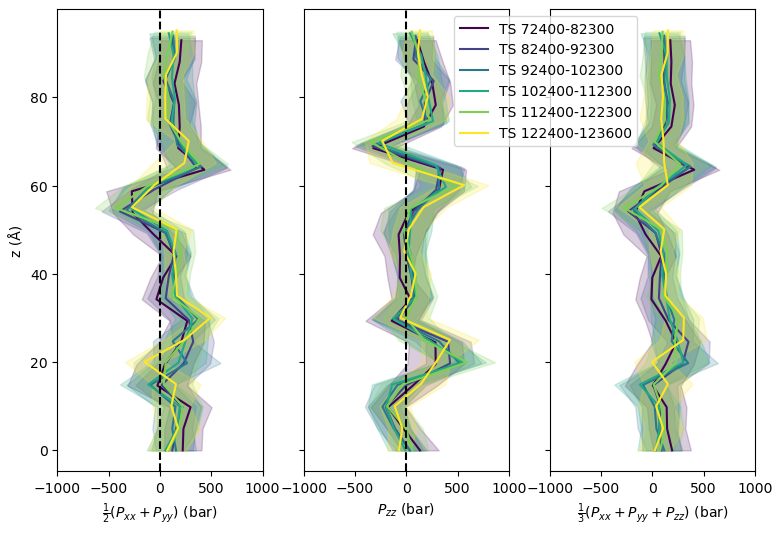
Pressure profiles for selected time intervals during the protein-embedded membrane relaxation.